Upper Frequency Response Variations


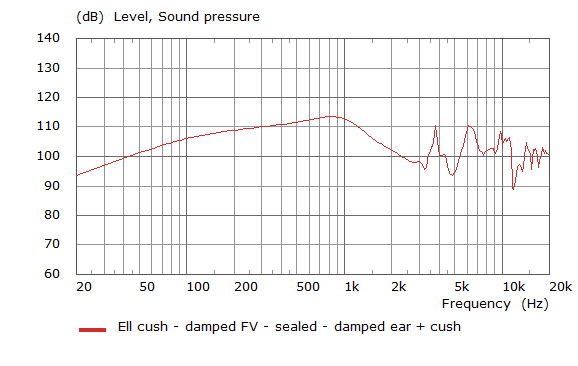
Despite the prescription of acoustic absorbency in the front cavity, the upper response has a number of persistent frequency response undulations which may not simply be explained by cavity modes. Acoustic pressure phase contours were generated from the models to investigate this further and illustrate the causes. The acoustic reference (mic) point is the ear drum position.
Inspecting the response below between 3.8kHz and 15kHz and displaying the acoustic phase contours is helpful is ascertain potential causes.
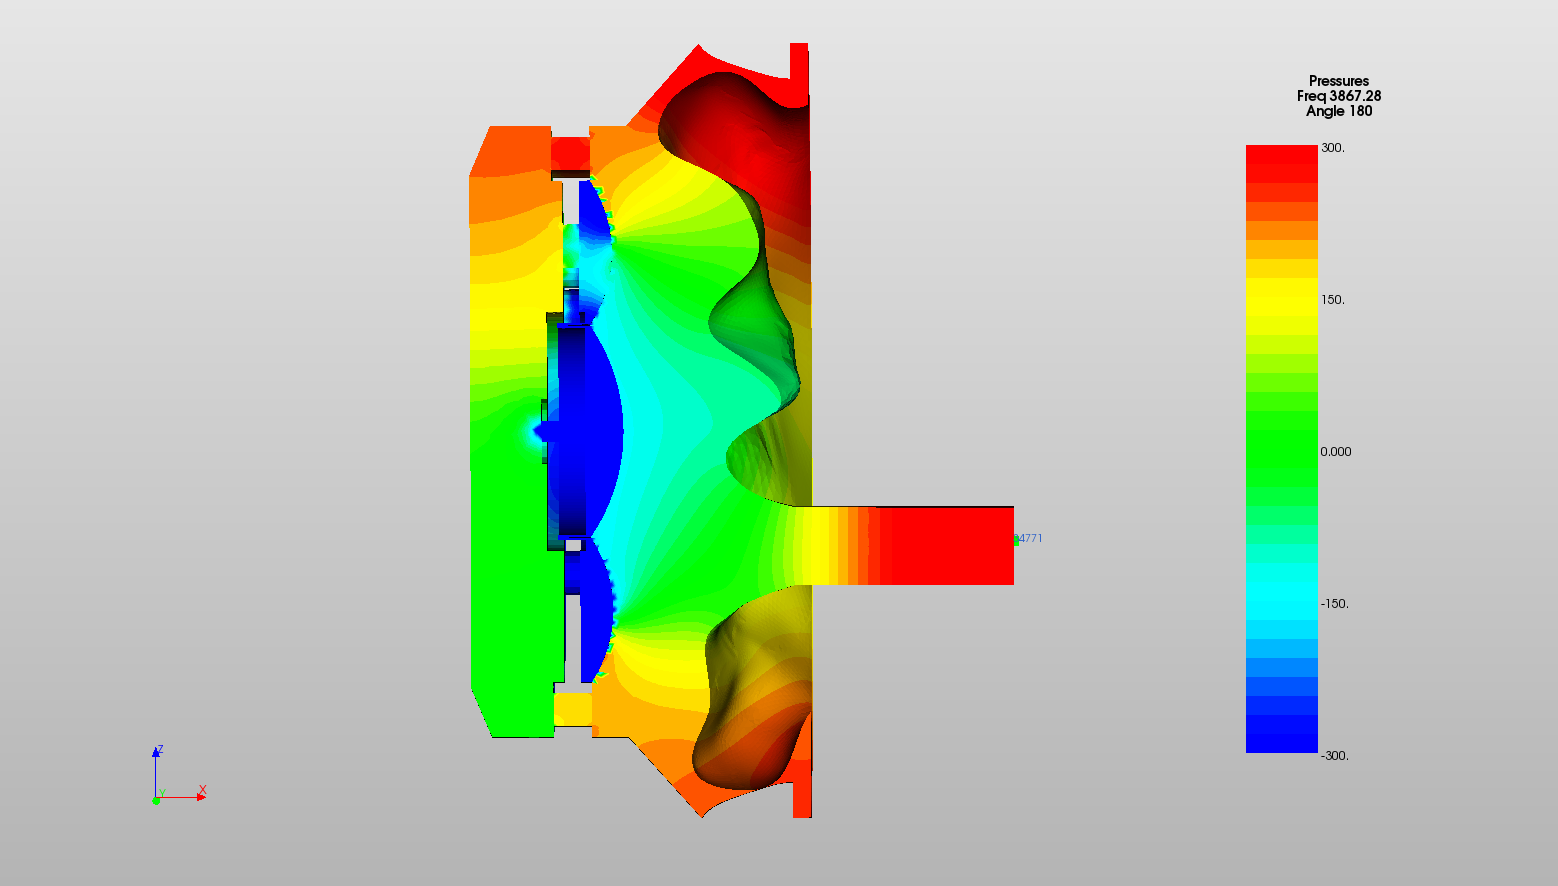
3.8kHz
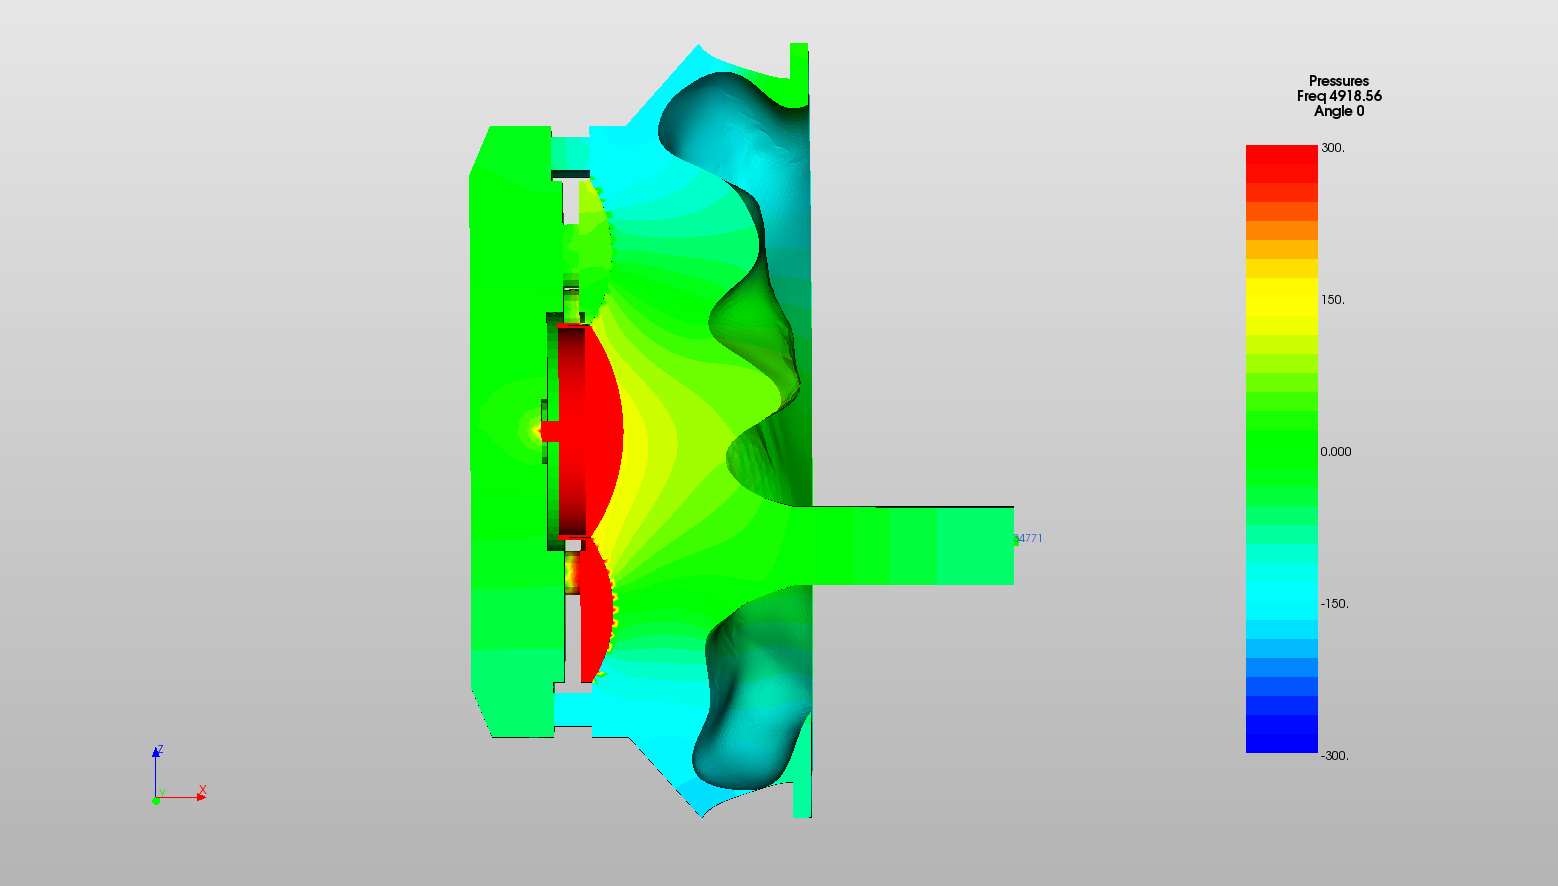
5kHz
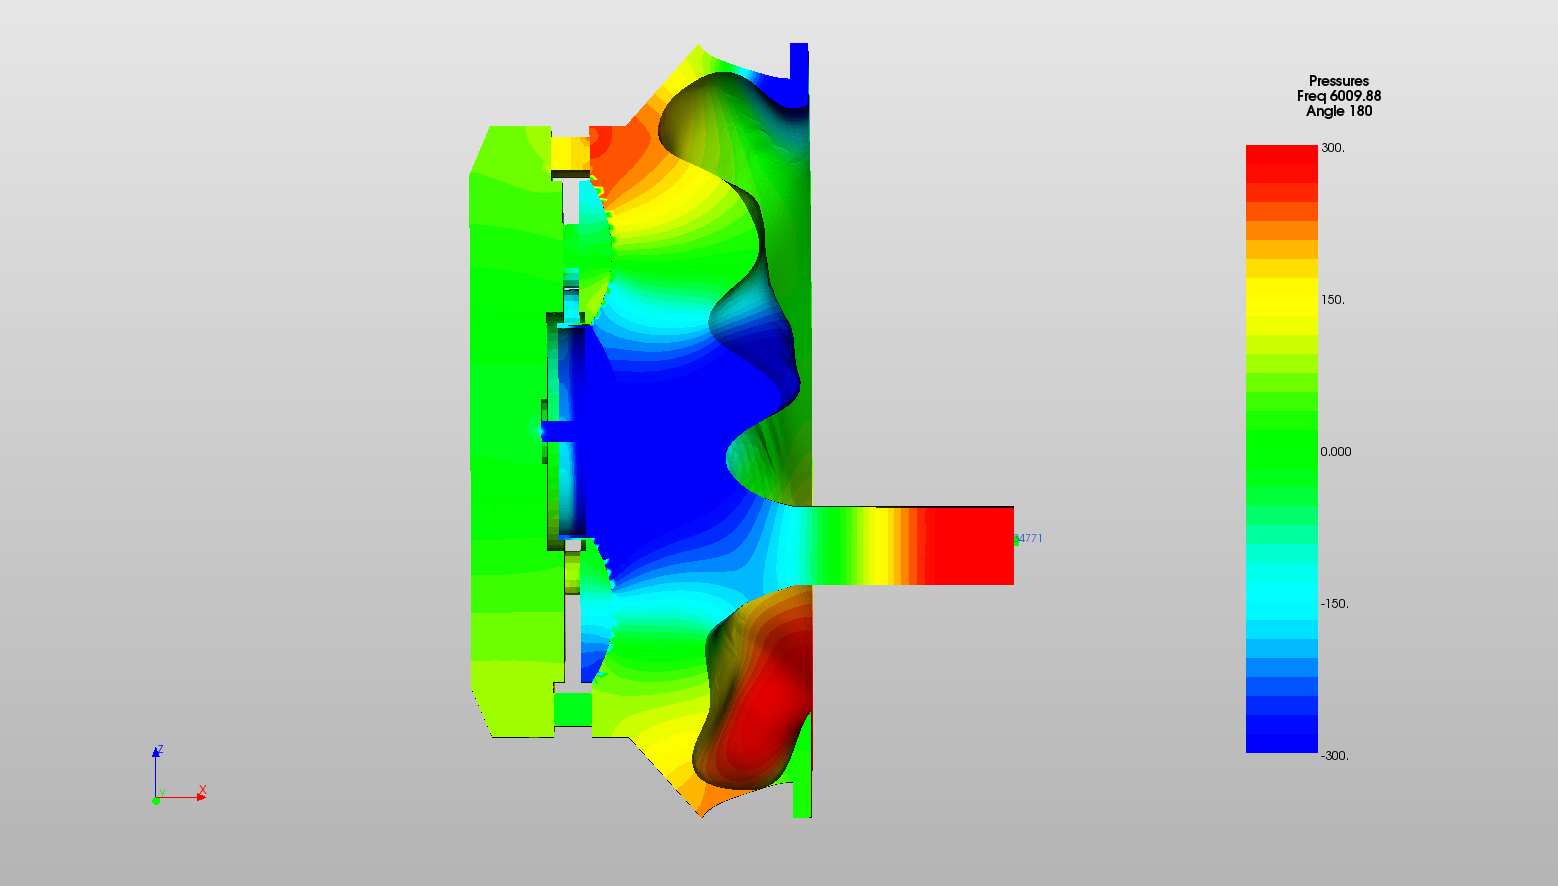
6kHz
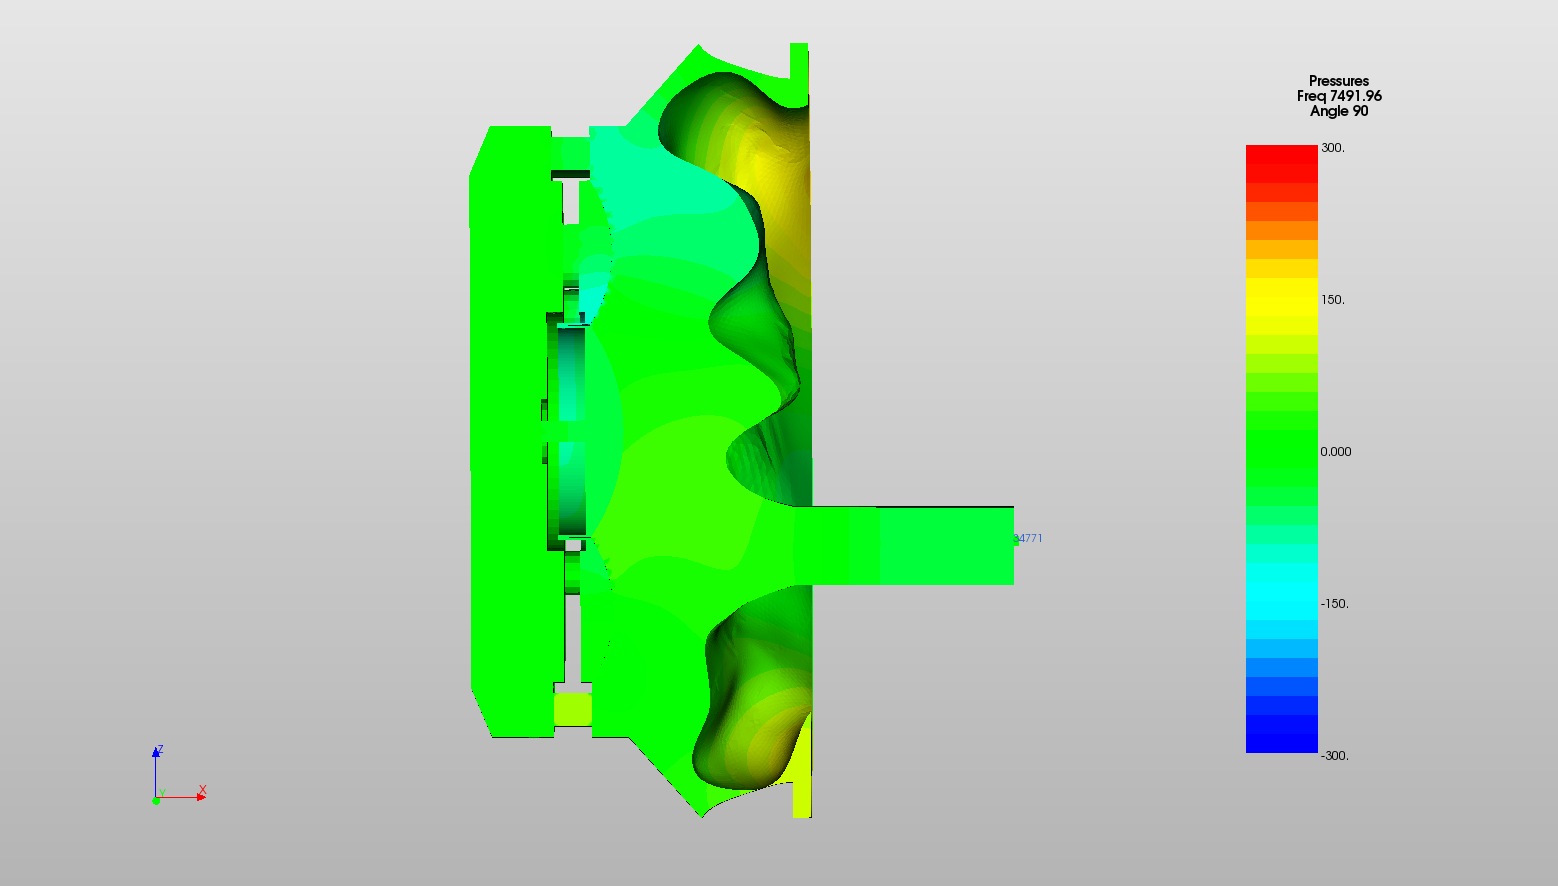
7.5kHz
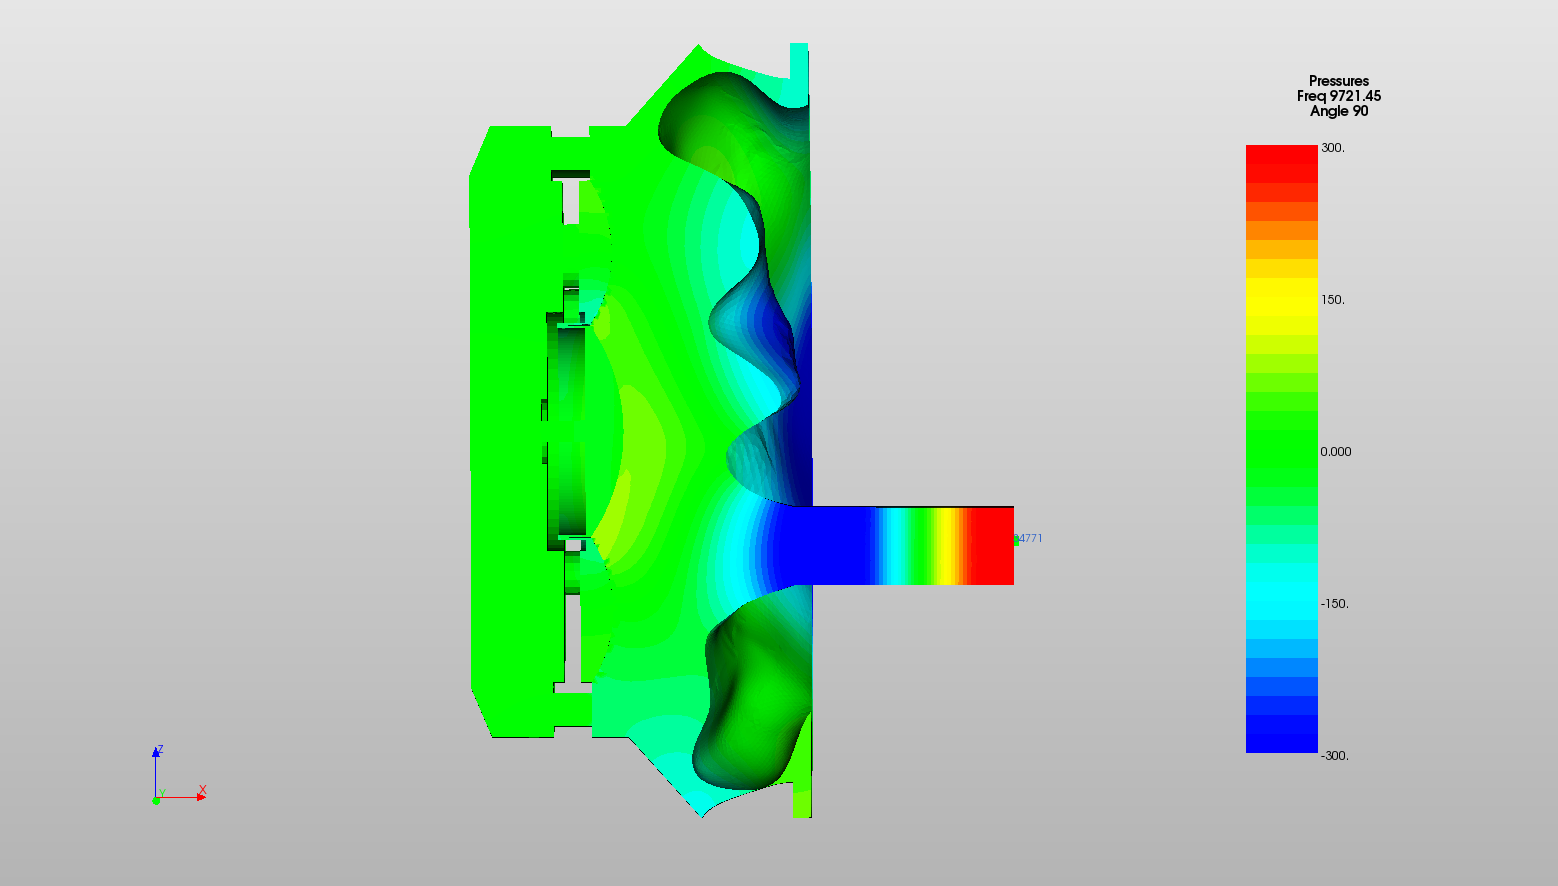
9.7kHz
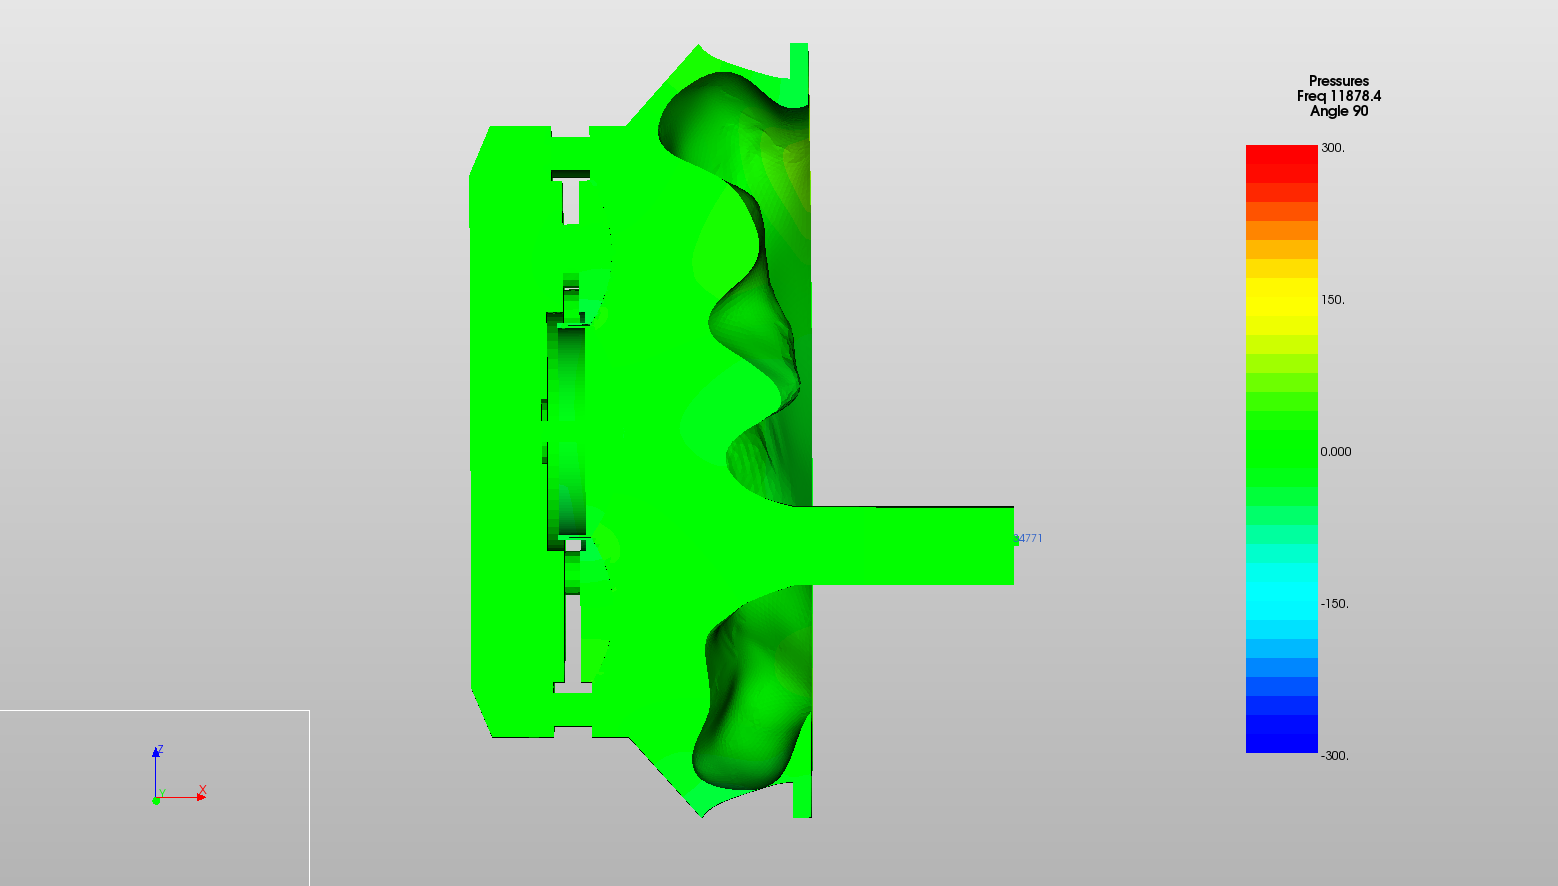
11.8kHz
14.2kHz
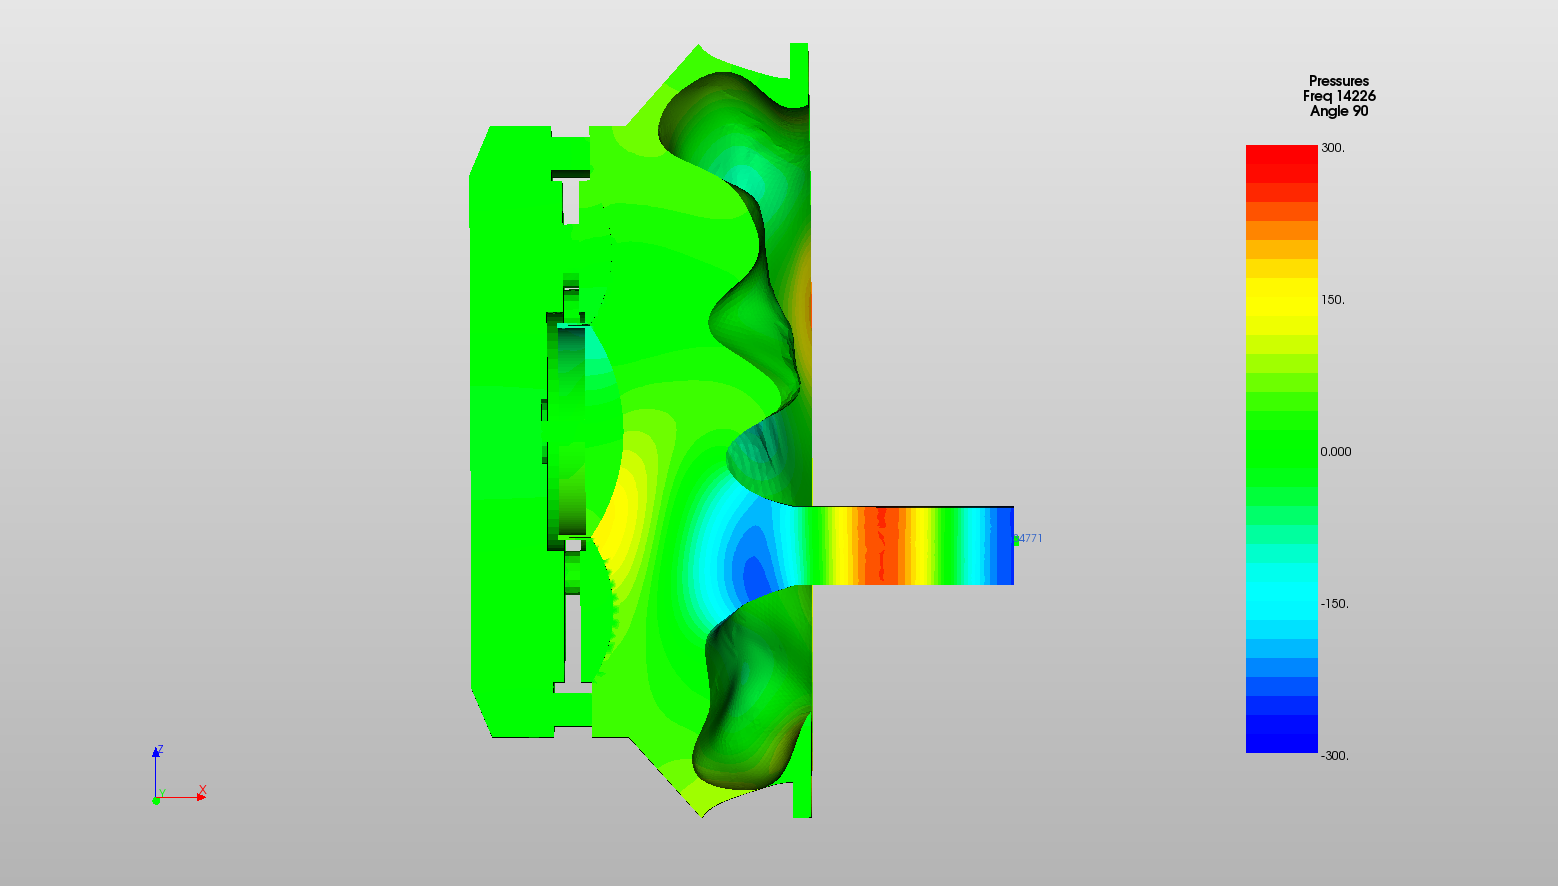
The pressure phase contours (range is clamped) show that the ear canal resonance is largely responsible for the peaks at 3.8kHz, 6kHz, 9.7kHz and 14.2kHz.
The rear sealed enclosure does not really seem to play a part here. The pressure magnitude appears to be much lower compared to regions in the front cavity surrounding the ear.
The behaviour between 5kHz and 6kHz is interesting. This feature involves a polarised pressure oscillation between the ear canal and the concha (depressed region at the entrance of the ear canal). In the free field model of the ear that was used to "tune" the ear canal loss, this oscillation did not produce a peak in the frequency response, but when the ear is enclosed by the headphone module, a consistent peak is observed.